What happens when you use the bioreality tool and everything we see
Clicking on the bioreality tool launches an iframe app and creates a temporary ID, time of use and your selected non-identifiable categories.
When the app launches it creates a temporary ID and time of use. You will be asked to select your country, age band and gender, and whether you identify as Long COVID or other complex conditions such as ME. These details shape how your graph displays and are only stored if you choose to submit your graph as community evidence. They allow us to show geographic and demographic patterns across the gallery we are creating for policy makers.
2.We provide a framework of quick drop down menus to create your own, unique health “events” and translate them into systems.
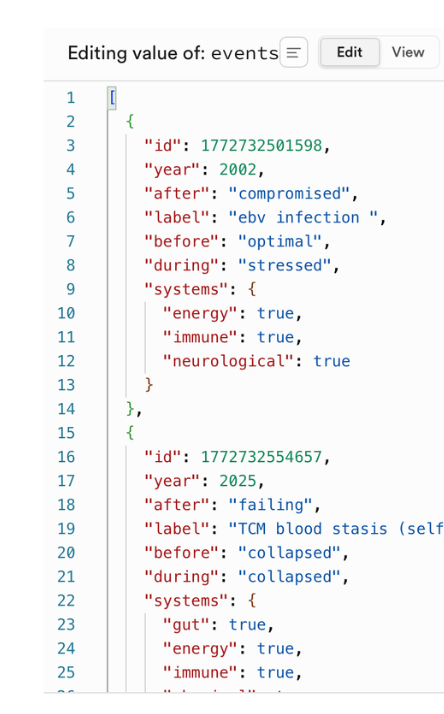
This creates a string of information with no identifiable user data, this is temporarily logged in our database so we can generate your graph image for you.
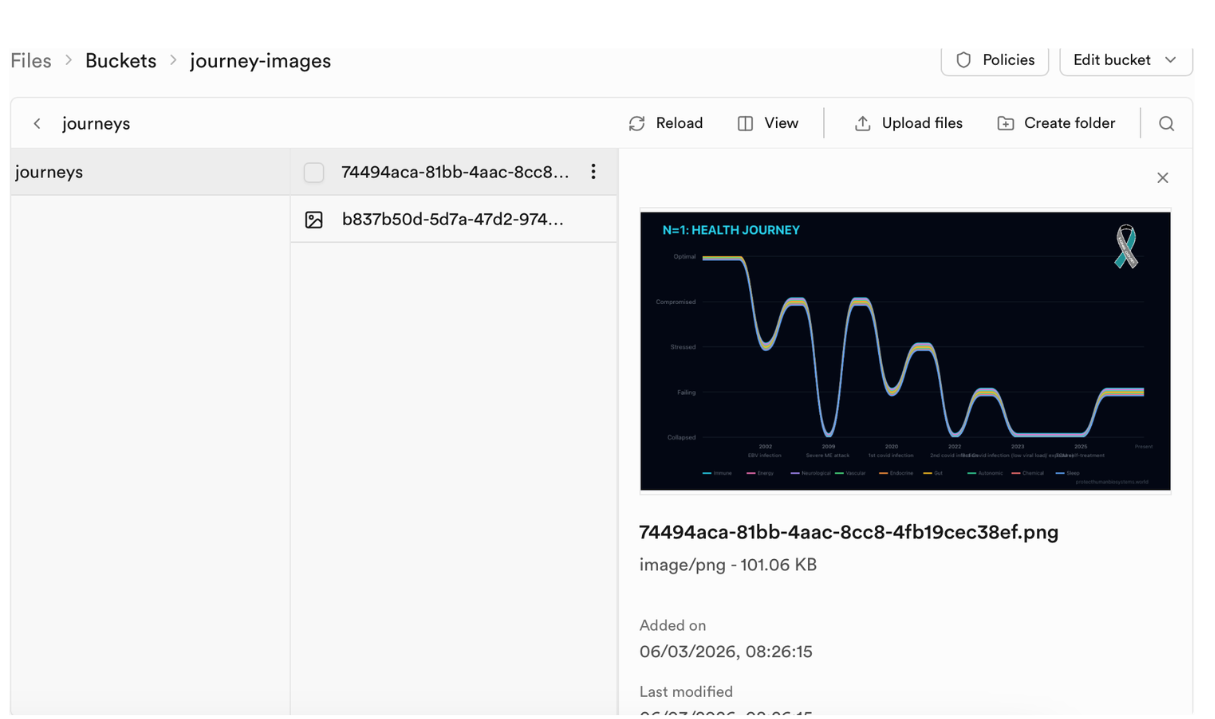
Here is an example of how that temporary data appears →
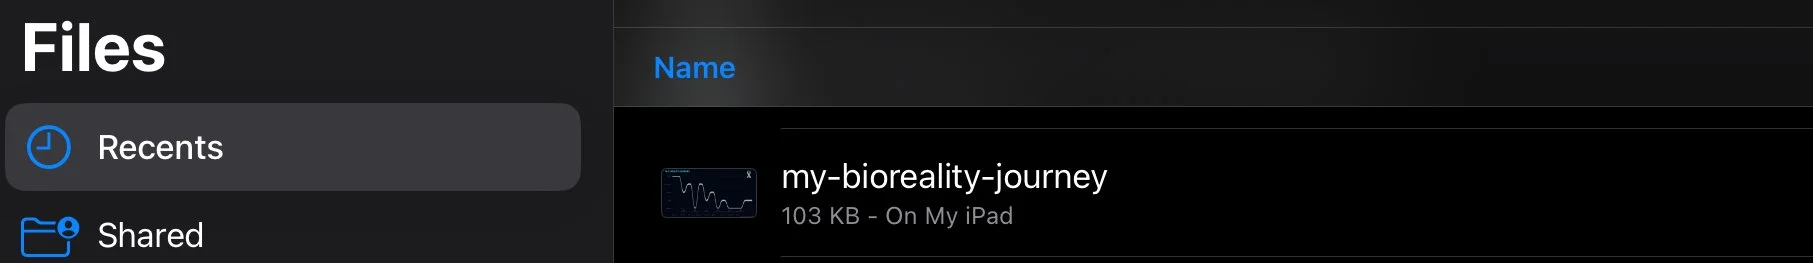
3. The “create graph” button will load an image with the data inputs you have added, including an image of your country flag. This will automatically be downloaded as a png for you to your desktop which you are free to use.
You can go back to add / delete your events, but refreshing the site will clear any data in the tool.
4. The box below the graph image will also give you the option to a) share your image (with suggested pre-written copy which you can edit) on social media or b) add your image to our community evidence database.
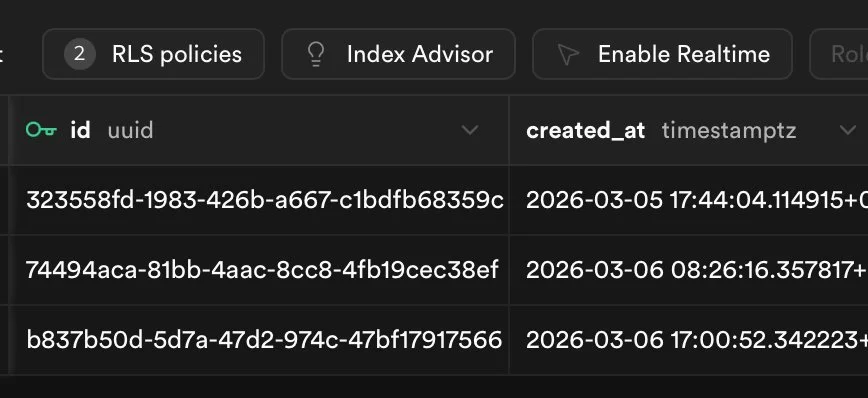
If you choose to add your image for community evidence this is how it will get stored, for as long as the purpose of the justice campaign and the project. There is no identifiable user information or event information. Just a png and the geographic, demographic, disease categories you selected at the start will be matched to the image URL.
No name, no email, no IP address, no identifying information of any kind. →
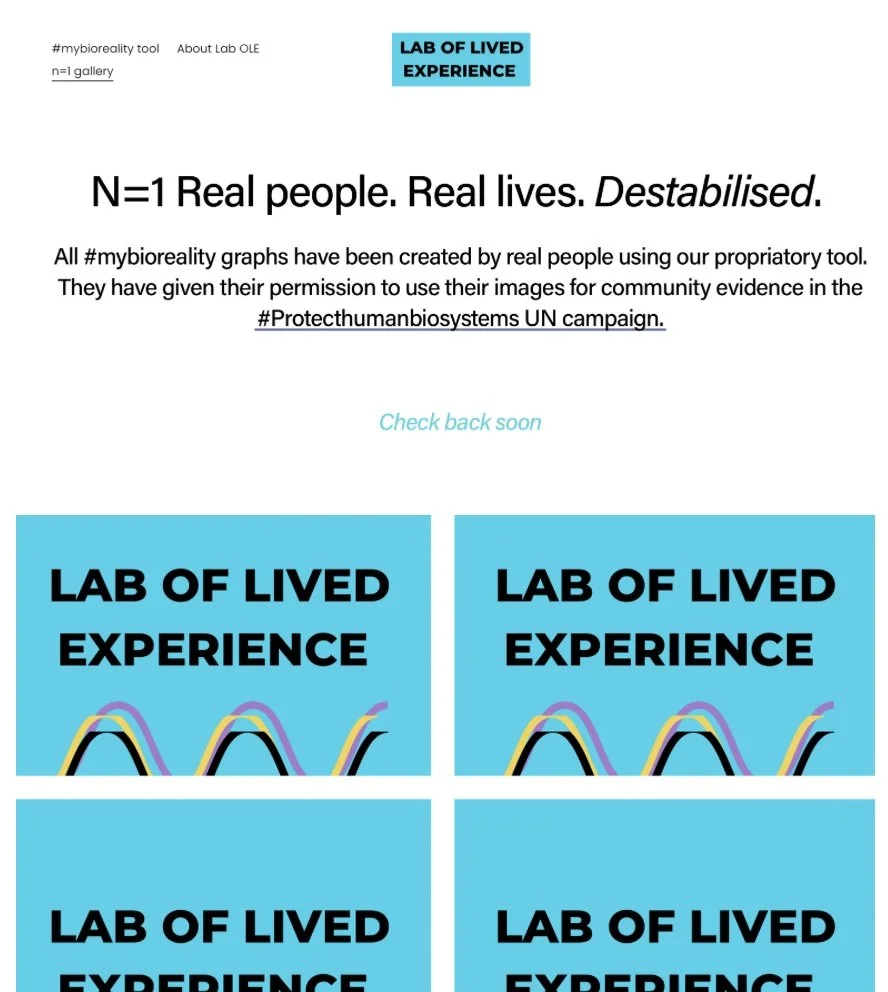
5. We will also add any images you choose to add to our community evidence to our n=1 gallery. This is to help policy makers see the global visual trend, with individual stories that don’t require any more words.
We will share the global trends page, not individual images with policy makers, business and finance stakeholders and anyone who joins the #protecthumanbiosystems campaign site or interacts with CSI Ecosystem (which we are part of). Each image will display a country flag, allowing policy makers and researchers to see the global geographic spread of biosystems destabilisation at a glance.