
We are building for community governance and justice-first.
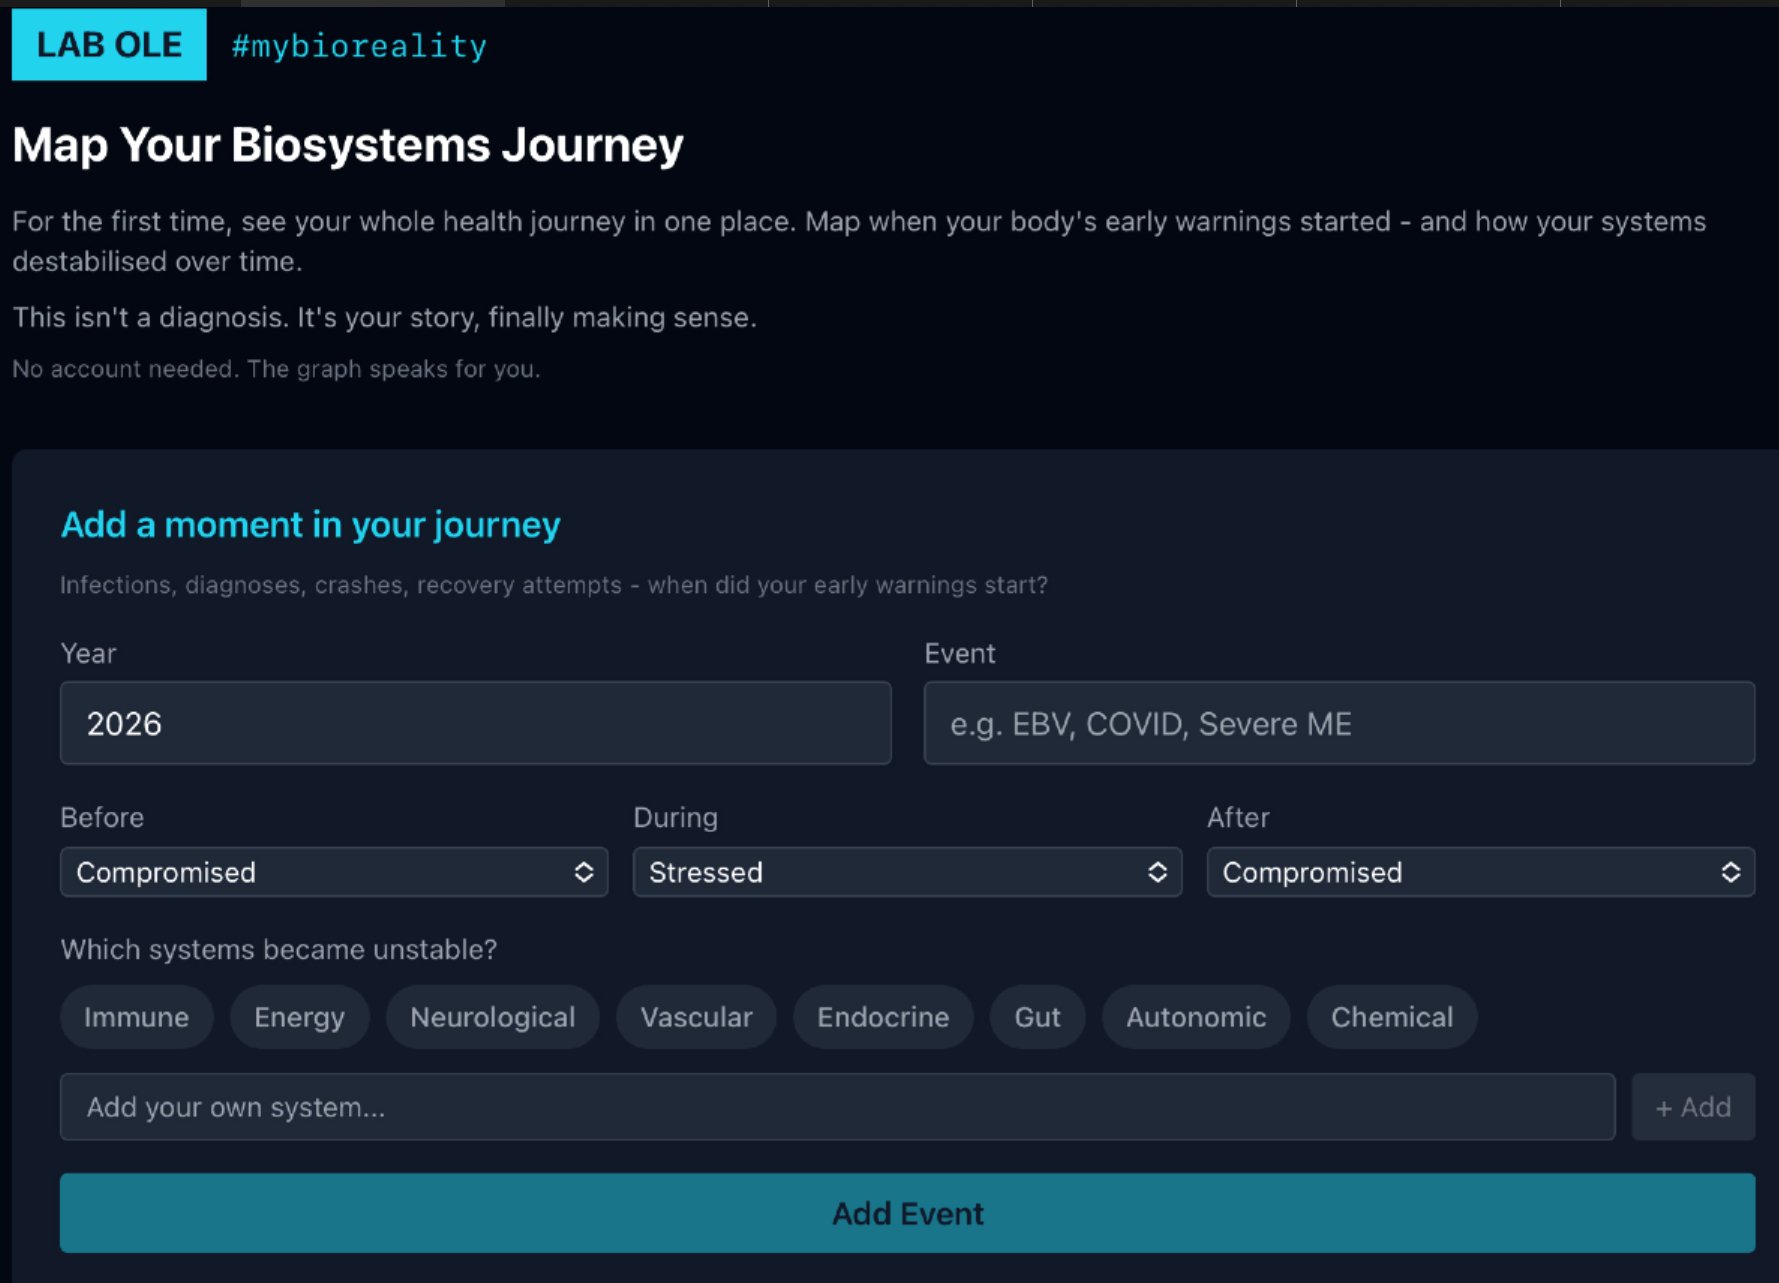
Map your biosystems journey
We’ve created a tool to help you tell the story of your unique and complex health.
For the first time, see how it all started…and where you are now.
We ask for non-identifiable data at the beginning to show your graph correctly, this will only be stored if you choose to share it as community evidence.
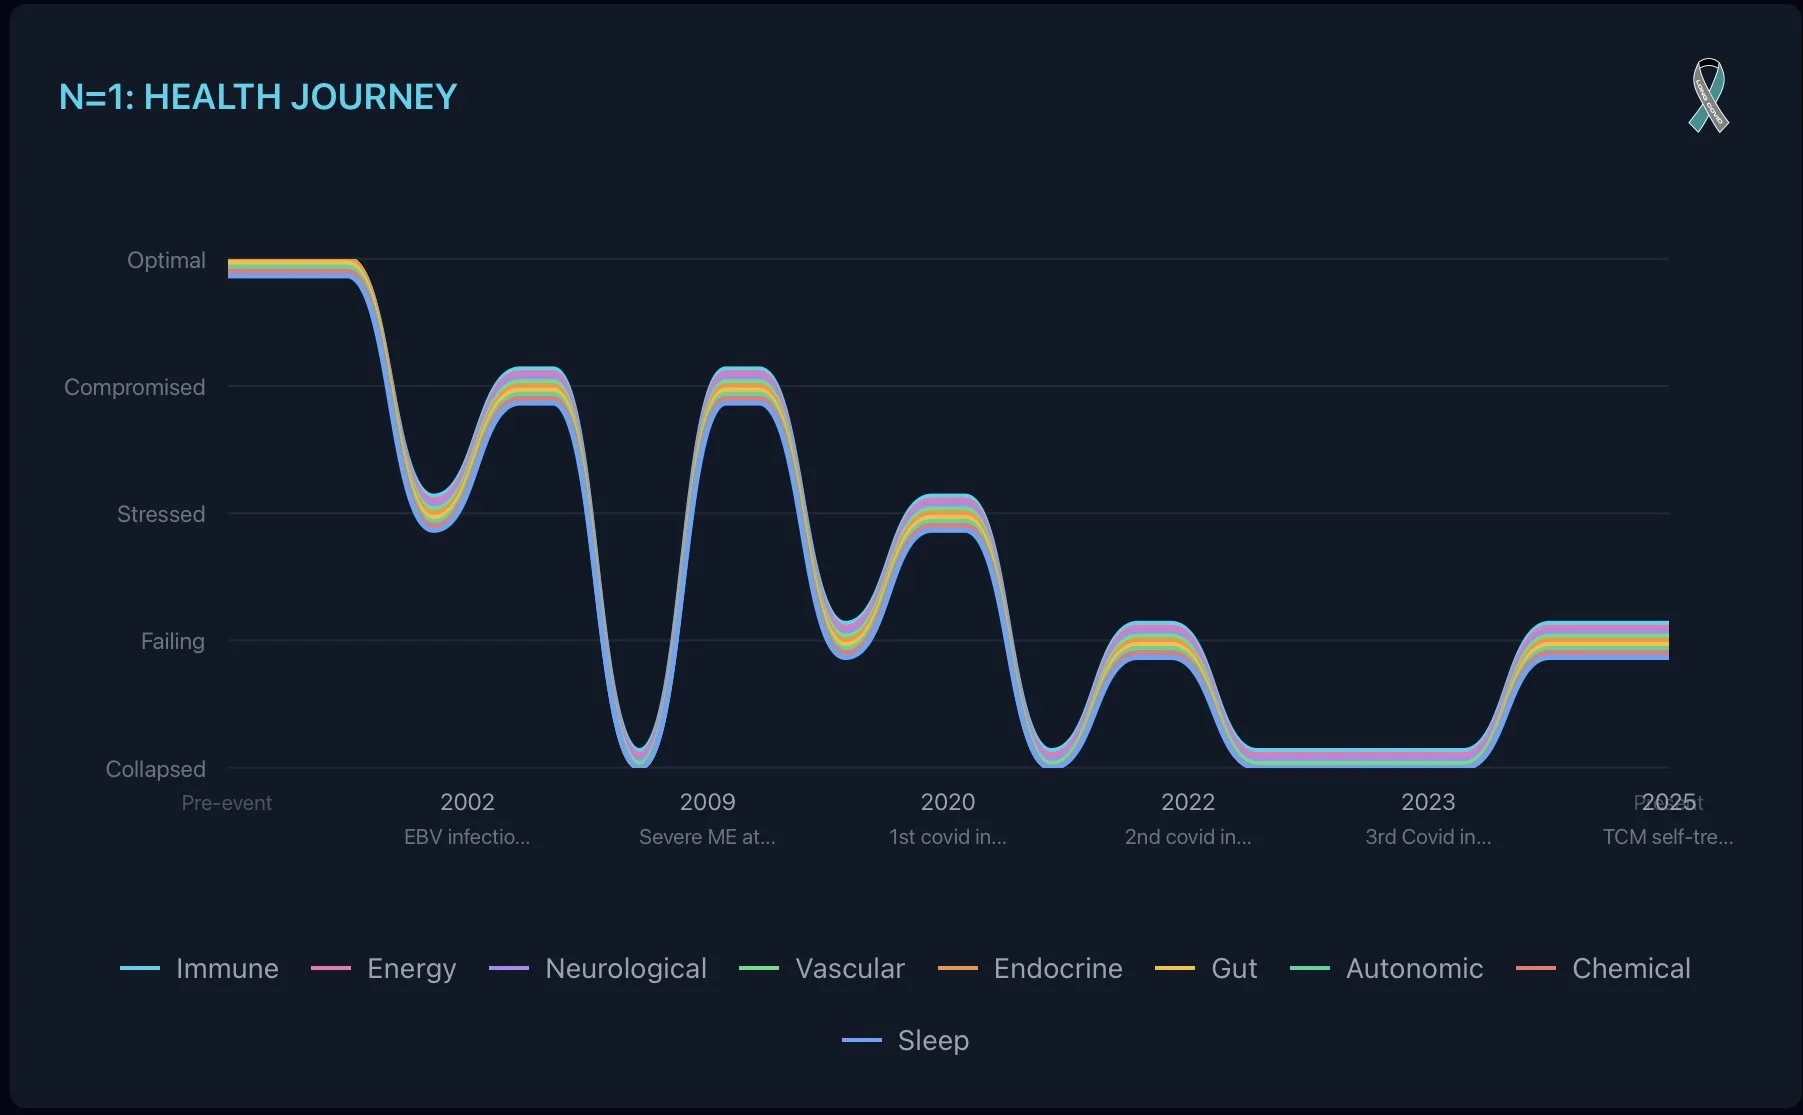
See your pattern over the years
Take 5 minutes to build a picture of it all.
Share it, and your story becomes part of the evidence we are building of the #bioreality of our collective experiences.
We will only ever share community data for projects that serve the community and we will always tell you how each project will use it.
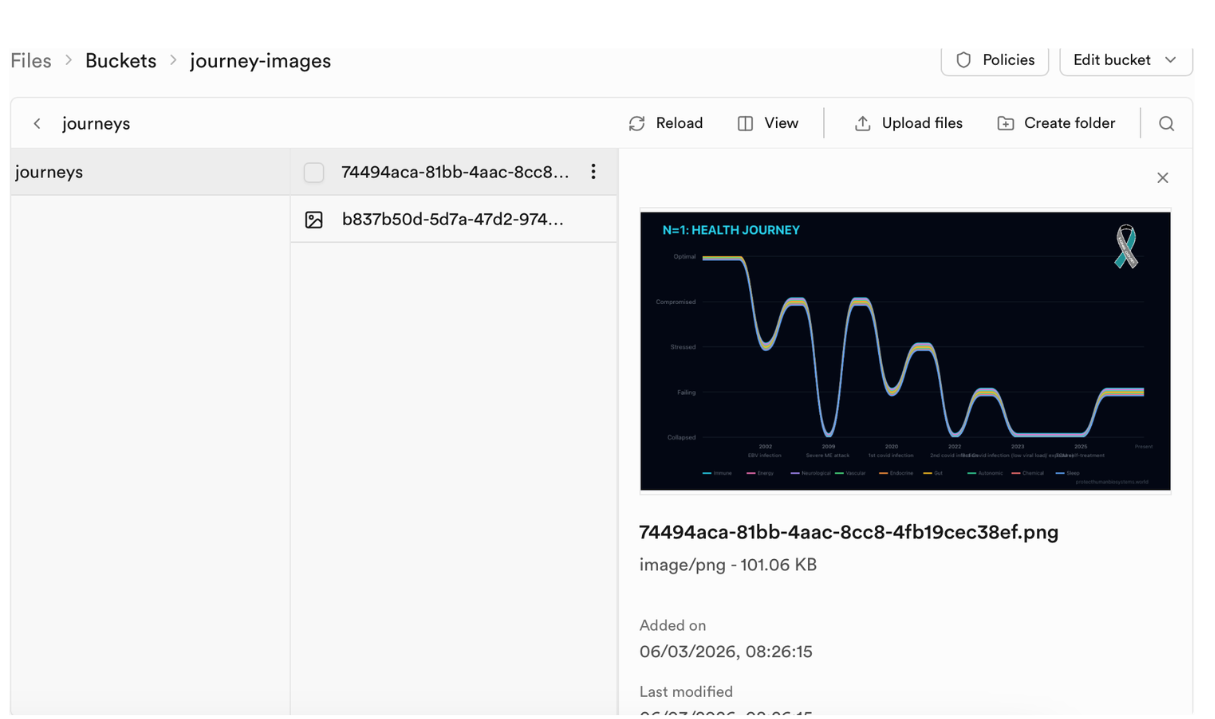
No identifiable user data is stored, just an image + filter categories
If you choose to share your anonymised graph with us the country, age bracket and gender you selected upfront will be stored. This data cannot be linked back to you by us or anyone else.
These categories help us align with existing research and policy formats to make it more useful for policymakers to see the trends.
See exactly what happens when you select to add your image to our community evidence and what we see
Our bodies are like climate systems
Experiencing cascading and cumulative impacts, tipping points and destabilising over time.
This is why we are asking the UN to recognise humans as biosystems that also need protection (includes prevention, treatment, support and investment).
Help us translate our global health into systems with two quick polls »
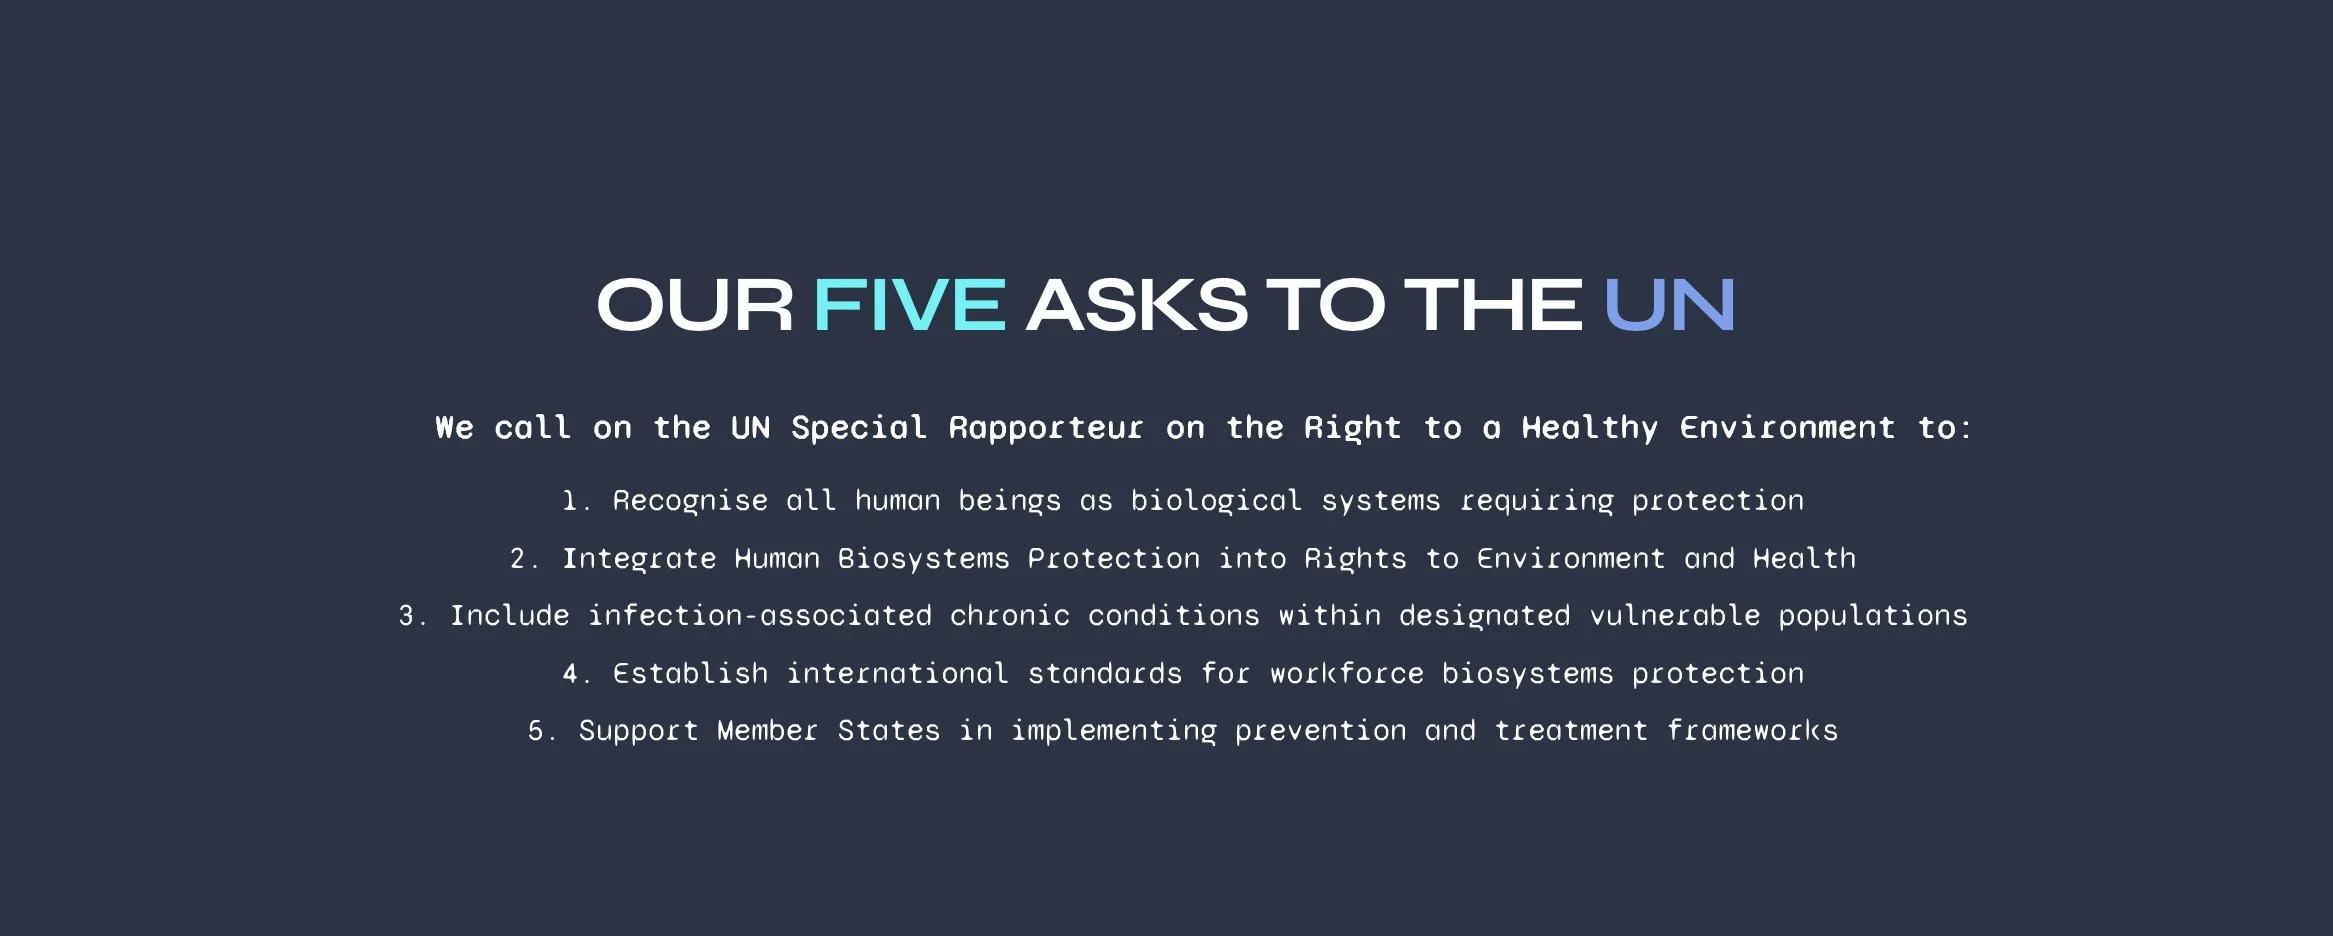
Justice-first design: Ask the UN to protect human biosystems
Adding your graph to community evidence helps us show the global trend and story that global health is a sustainability crisis to business and finance.
Lab OLE is also part of the campaign and an open letter to the UN Special Rappateur of the Right to a Healthy Environment, backed by leading bioscience professors, clinicians, impact finance and systems leaders.
Dear Charities and Advocacy Groups
We've built this tool for the communities you work with, It's free, anonymous, and designed for people with complex health conditions who are tired of explaining.
Sharing the tool with your community helps us gather evidence for the UN letter which is backed by leading bioscience professors, clinicians, impact finance and systems leaders along with community members showing their support.
The more journeys we collect, the harder the pattern is to ignore and the greater the justice case we can start building.
How you can help
Share the bioreality polls and tool with your community
Media and PR support
Your Questions, Answered
-
Before you use the tool we ask for non-identifiable categories to help us show the graph correctly along with your selected country flag. However, your journey stays in your browser and only if you choose to 'Share to Lab OLE' do we save an anonymised version of your graph: the categories you selected, pattern of events, systems, and severity levels. No names, no IP addresses, no identifiable personal information. You can see exactly what we see here at every stage here.
-
Shared graphs become part of our community evidence base. We use them to show the collective pattern of hundreds of journeys revealing the same trajectory. This evidence supports our open letter to the UN calling for human biosystems protection
-
Because we don't collect identifying information, we can't link a shared graph back to you. This protects your privacy but means we can't delete individual submissions. Only share if you're comfortable with your anonymised pattern being part of the collective.
-
No, there is no account and no login, so no email is required.
-
No. This is purely a way to visualise your own health journey using a climate systems framework. It's not a diagnostic and does not provide medical advice.
-
Complex health conditions affect multiple interconnected systems. Whilst tracking symptoms gives us a list, mapping the systems impacted visualises a pattern over-time.
(It’s like moving from tracking weather events to understanding climate change at scale).